
What is TV Charts?
The website provides users with a visual representation of TV show ratings throughout an entire series. By leveraging IMDb data, the platform generates dynamic charts that illustrate the fluctuations in audience reception over the course of a show's episodes. This allows viewers to gain a comprehensive understanding of a program's performance and identify any notable shifts in viewer sentiment over time. The data visualization capabilities of the website empower users to explore and analyze viewership patterns, enabling them to uncover insights about the show's trajectory and appeal
Highlights
- Automatic data acquisition from IMDb
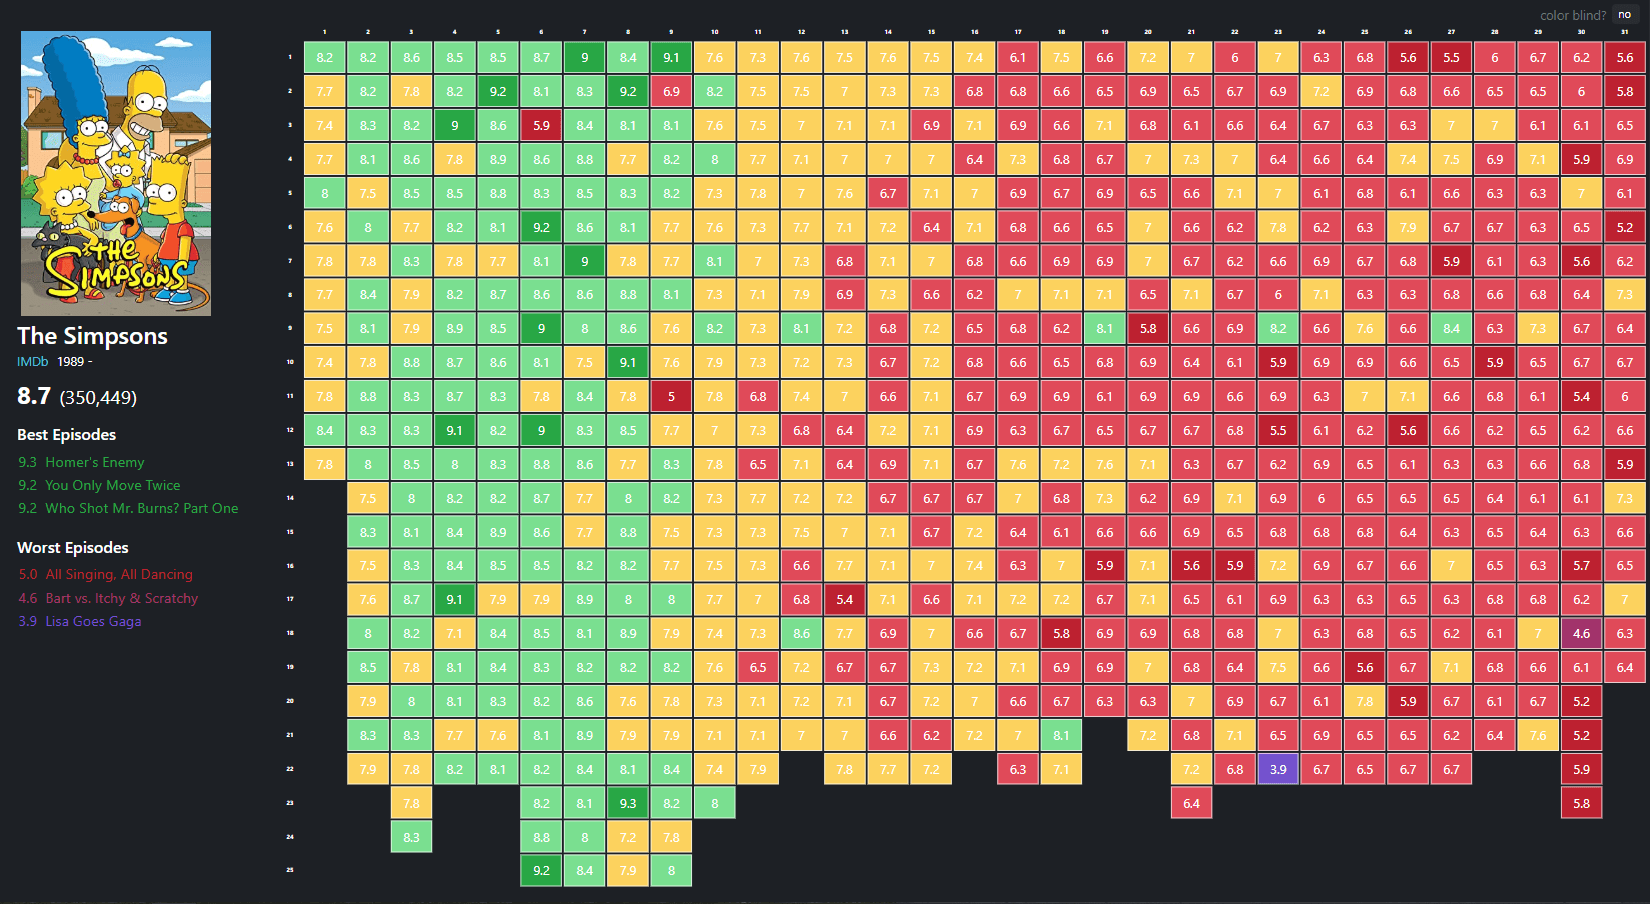
- Dynamic creation of charts depicting episode-level ratings
- Ability to explore viewership patterns over the course of a TV series
- Insights into audience sentiment and engagement throughout a show's run
Platforms
- Web