

What is Google Charts?
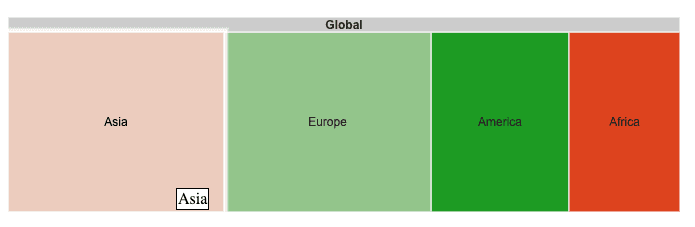
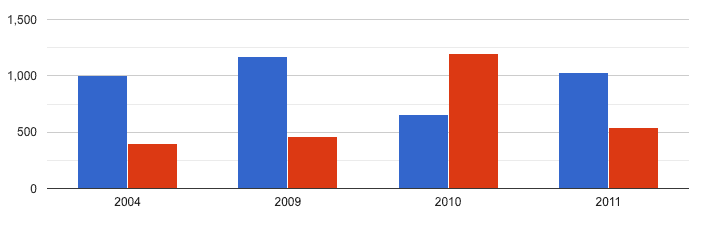
Google Charts is a robust data visualization tool that enables businesses to effectively present their data in a wide range of chart types, including pie charts, scatter plots, tree maps, and more. The cloud-based application offers a comprehensive charts gallery, allowing users to access and customize various chart formats, such as line charts and hierarchical tree maps. This interactive web service allows users to supply data and formatting specifications expressed in JavaScript, which are then rendered as interactive graphical charts. As a charting library, Google Charts provides businesses with a versatile solution to enhance their data presentation and analysis capabilities
Highlights
- Comprehensive charts gallery with a variety of chart types, including pie charts, scatter plots, tree maps, line charts, and hierarchical tree maps
- Cloud-based platform for easy access and collaboration
- Customizable data visualization capabilities with JavaScript-based formatting specifications
- Interactive graphical charts generated from user-supplied data
Platforms
- iPhone
- Cloud, SaaS, Web-based
- Desktop Chromebook
- Desktop Windows
- Desktop Mac
- Mobile Android
- iPad
- On-Premise Windows
- Web-based
- Desktop Linux
- On-Premise Linux
- Mobile iPhone
- Mobile iPad
- Android
Social
Features
Animation
visualization
pie-chart
SVG
bar-chart
Charts