

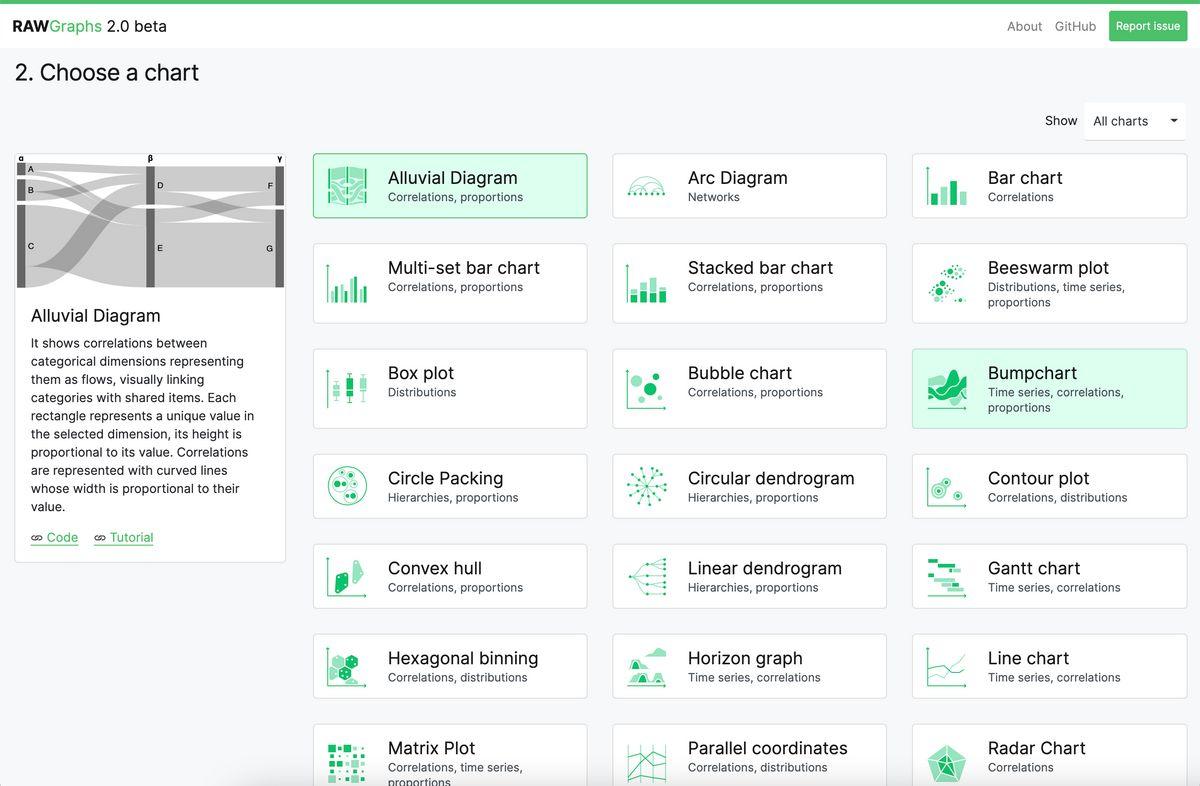
What is RawGraphs?
RAW Graphs is a powerful open-source data visualization framework that aims to make the visual representation of complex data accessible to everyone. Conceived as a tool for designers, data enthusiasts, and visualization experts, RAW Graphs bridges the gap between spreadsheet applications and vector graphics editors, enabling users to effortlessly convert their data sets into a wide range of customizable graphs and charts The project, led and maintained by the DensityDesign Research Lab at the Politecnico di Milano, was first released to the public in 2013 and has since become one of the most essential tools in the field of data visualization. The team responsible for the design, development, and ongoing maintenance of RAW Graphs includes members from DensityDesign, Calibro, and Inmagik, who joined the project in 2019
Highlights
- Diverse Visualization Formats: RAW Graphs supports a wide variety of chart and graph types, including scatter plots, bar charts, line charts, pie charts, and more, allowing users to choose the most appropriate visualization for their data
- Flexible Data Input: The application can import data from various sources, including spreadsheet applications, CSV files, and JSON data, making it easy to integrate with existing data workflows
- Customizable Visualizations: Users can easily customize the appearance and layout of their visualizations, adjusting colors, fonts, and other visual elements to create unique and impactful data representations.
Platforms
- Desktop Windows
- Desktop Chromebook
- Mobile iPhone
- Mobile iPad
- Online
- On-Premise Linux
- Cloud, SaaS, Web-based
- Desktop Linux
- Web
- On-Premise Windows
- Mobile Android
- Self-Hosted
- Desktop Mac
Languages
- English
Social
Features
Graphs
Works Offline
Data visualization
Charts
Drag and Drop
Gantt-charts