

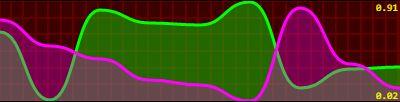
What is Smoothie Charts?
A JavaScript charting library designed for live streaming data, Smoothie Charts allows users to visualize real-time information in a flexible and responsive manner. The library offers a simple yet powerful interface, enabling developers to quickly integrate dynamic charting capabilities into their applications. With its efficient handling of large datasets and focus on performance, Smoothie Charts is an ideal solution for monitoring systems, financial dashboards, and other data-intensive use cases
Highlights
- Live Streaming Data Visualization: Smoothie Charts is optimized for rendering real-time data, enabling users to track and analyze information as it evolves
- Flexible Configuration: The library provides a range of customization options, allowing developers to tailor the charts to their specific needs and branding requirements
- Efficient Data Handling: Smoothie Charts is designed to handle large volumes of data without compromising performance, making it suitable for high-traffic applications
- Responsive Design: The library adapts to different screen sizes and devices, ensuring a consistent user experience across various platforms.
Features
Optimal performance